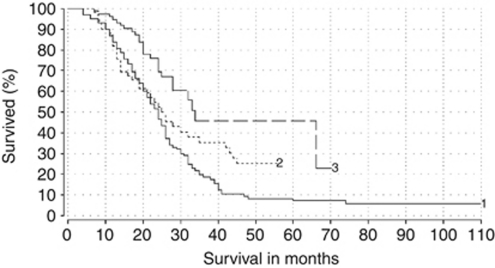
Figure 3.
Kaplan–Meier survival curves demonstrating the survival of the patients divided in three groups by virtue of the chemotherapeutic drug used: Group 1 received Mitomycin (n=98, median survival 24 months). Group 2 treated with a Mitomycin-Gemcitabine combination (n=49, median survival 23 months). Group 3 treated with a Mitomycin-Irinotecan combination (n=77, median survival 22.5 months). Log-rank test results showed a statistically significant difference between the three groups of patients (P<0.01).

