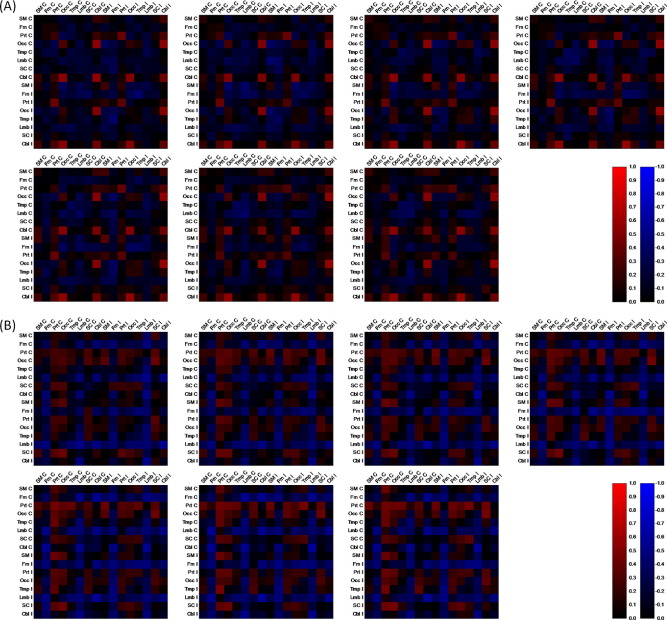
Supplementary Fig. 2.
Distribution of correlation coefficients between brain regional efficiency and age at connection densities from 0.10 to 0.40 with an increment of 0.05 for (A) dominant and (B) nondominant hand grip when considering 16 brain regions. Black-red and black-blue indicate positive and negative correlations respectively between age and efficiency of the corresponding intra- or interregional networks. Abbreviations: C, contralateral; Cbl, cerebellar; Frn, frontal; I, ipsilateral; Lmb, limbic and/or paralimbic; Occ, occipital; Prt, parietal; SC, subcortical; SM, sensorimotor; Tmp, temporal.

