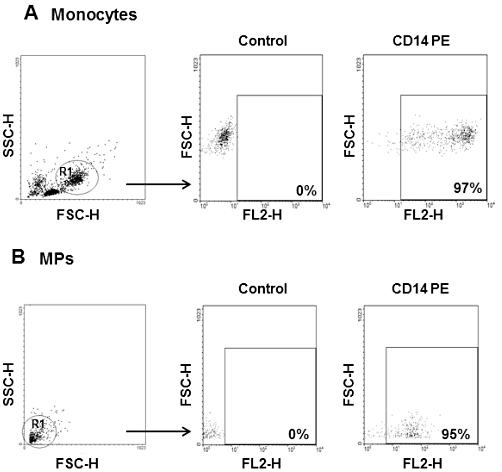
Figure 1.

Flow cytometry analysis of monocyte-derived microparticles (MPs). Human monocytes (1 × 10⁶; resuspended in 100 µL PBS) and 100 µL of MPs were analysed. Regions (R1) corresponding to monocytes (A) and MPs (B) were defined on forward (FSC) versus side angle light scatter (SSC) intensity dot plot representation and CD14 expression positivity was defined on FL2 (PE fluorescence) versus FSC dot plot representation. MPs have smaller physical parameters and show similar percentage of CD14 positivity compared to monocyte population.
