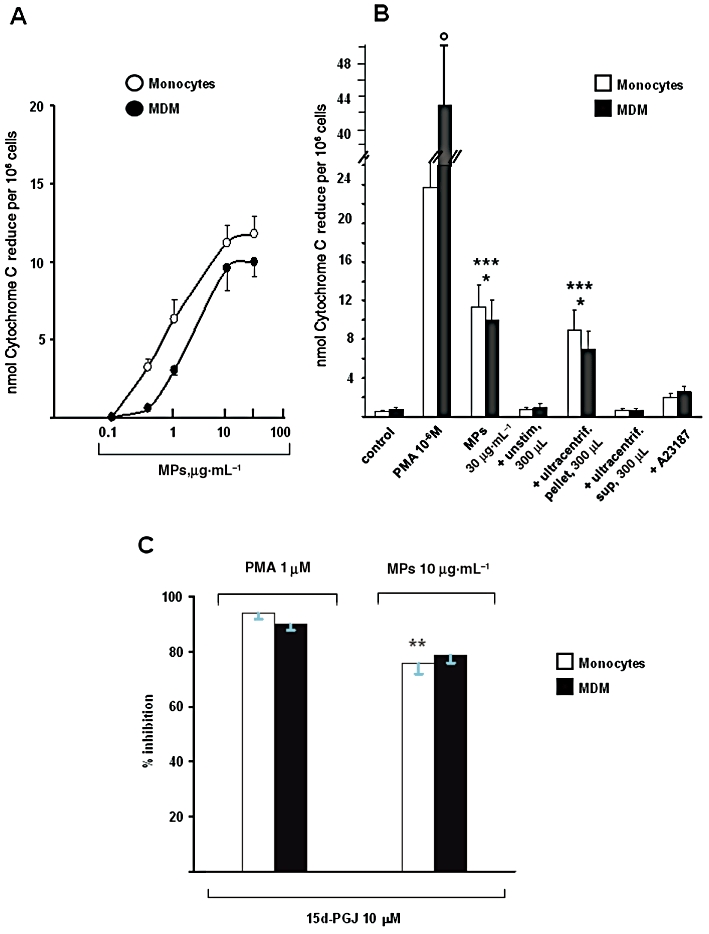
Figure 3.

Monocyte-derived MPs induce superoxide anion (O2−) production in human monocytes and monocyte-derived macrophages (MDM). Human monocytes and MDM were challenged with the different stimuli for 30 min. In A: concentration-dependent (0.1–30 µg·mL−1) effects of MPs. Values are means ± SEM; n = 14 (monocytes), 8 (MDM). In B: superoxide anion production induced by MPs, PMA, A23187, ultra-centrifuged supernatants and pellets. Cells were challenged with PMA (1 µM), MPs (30 µg·mL−1), A23187 (4 µM), supernatant (300 µL) from un-stimulated monocytes, ultra-centrifuged supernatant (300 µL) from A23187-stimulated monocytes or ultra-centrifuged pellet (300 µL) from A23187-stimulated monocytes. Please, note that, in these experiments, spontaneous (control) O2− production was not subtracted. +unstim, 300 µL = supernatant (300 µL) from un-stimulated monocytes added to cells; +ultracentrif, sup 300 µL = ultra-centrifuged supernatant (300 µL) from A23187-challenged monocytes added to cells; +ultracentrif, pellet 300 µL = ultra-centrifuged pellet (300 µL) from A23187-challenged monocytes added to cells. Mean ± SEM (n = 8–14 for control, PMA and MPs; n = 3 for the others). °P < 0.05 versus monocytes; *P < 0.05 versus PMA; ***P < 0.001 versus control. In C: % inhibition of PMA- or MPs-evoked O2− production by 15d-PGJ2 (15d-PGJ; 10 µM) in both cell types. Cells were treated with the endogenous PPARγ agonist for 30 min and then challenged with MPs (10 µg·mL−1) or PMA (1 µM). Data are expressed as mean ± SEM of five separate experiments in each cell type. **P < 0.01 versus PMA.
