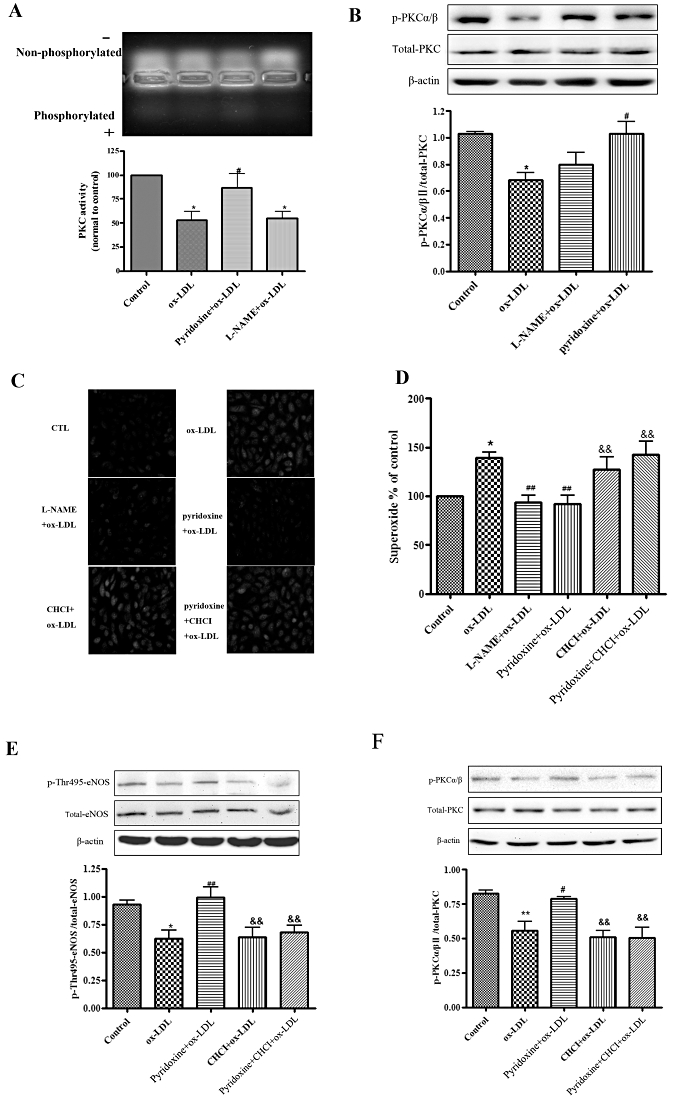
Figure 4.

PKC regulated the effect of pyridoxine in ox-LDL-treated HUVECs. (A) Representative agarose gel separation of phosphorylated PepTag showed fluorescent phosphorylated Peptag (upper panel). The bands corresponding to the phosphorylated peptide were quantified and normalized to controls (lower panel). (B) Western blot analysis showed the expression of phosphorylated PKCα/β, total-PKC and β-actin. Phosphorylation was quantified densitometrically as the ratio of p-PKCα/β/total-PKC. (n = 6 *P < 0.05 vs. control, #P < 0.05 vs. ox-LDL). (C, D) Cells were treated or untreated with pyridoxine(10−7 mol·L−1), CHCI (5 µmol·L−1), L-NAME (100 µmol·L−1) for 15 min followed by incubation with 20 mg·L−1 ox-LDL for another 24 h. Endothelial O2•− production was measured by DHE using fluorescence microscope and flow cytometric. (n = 7 *P < 0.05 vs. control, ##P < 0.01 vs. ox-LDL, &&P < 0.01 vs. pyridoxine + ox-LDL). (E) Western blot analysis showed the expression of phosphorylated eNOS Thr495, total-eNOS and β-actin. Phosphorylation was quantified densitometrically as the ratio of p-Thr495-eNOS/total-eNOS (n = 5 *P < 0.05 vs. control, ##P < 0.01 vs. ox-LDL, &&P < 0.01 vs. pyridoxine + ox-LDL). (F) Western blot analysis showed that the expression of phosphorylated PKCα/βII, total-PKC and β-actin. Phosphorylation was quantified densitometrically as the ratio of p-PKCα/βII/total-PKC (n = 5 **P < 0.01 vs. control, #P < 0.05 vs. ox-LDL, &&P < 0.01 vs. pyridoxine + ox-LDL).
