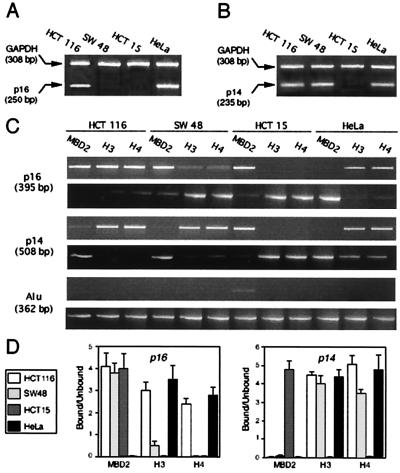
Figure 3.
Expression of p16 and p14 and ChIP analysis of MBD2 and acetylated histones H3 and H4 in colon cancer cell lines and HeLa. (A) p16 transcripts were coamplified by RT-PCR, with the GAPDH transcripts as an internal control; 1 μg of total RNA from HCT116, SW48, HCT15, and HeLa cells was used. PCR products (5 μl) were separated by electrophoresis on a 2% agarose gel, and positions of the bands for p16 (250 bp) and GAPDH (308 bp) are indicated on the left. (B) Expression of p14 was analyzed by RT-PCR after coamplification of p14 transcript (235 bp) with GAPDH (308 bp). (C) PCR analysis of DNA in chromatin immunoprecipitated with anti-MBD2 and anti-acetylated histone H3 and H4 for p16 (395 bp), p14 (508 bp), and Alu (362 bp). Experiments were performed on the following cell lines: HCT116 with one allele methylated (M+) for p16 and p14 M−; SW48 with p16 M+ and p14 M−; HCT15 with p16 M+, p14 M+, and HeLa cells with p16 and p14 M−. (D) Statistical analysis (mean ± SD of at least three experiments) of the enrichment of the bound DNA fraction compared with the unbound DNA fraction for p16 and p14, for each antibody and in each cell line.

