
Figure 4. HDL kinetics in mice.
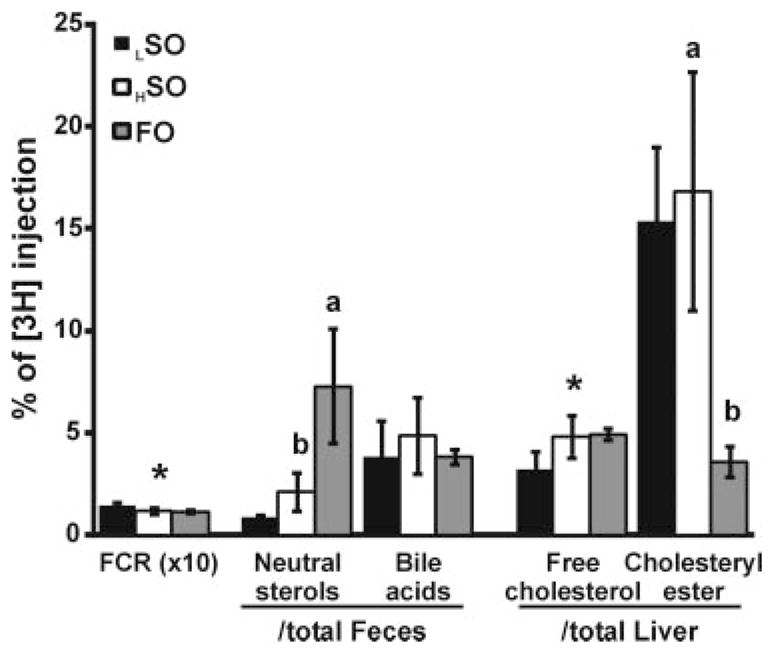
Mice were fed LSO, HSO, or FO diets (n=5 per each group) for 4 weeks and received intravenously injections of [3H]-cholesterol oleate labeled HDL. Fractional catabolic rate (FCR) for plasma HDL-CE was calculated based on the disappearance of [3H]-tracer from plasma of each group. The FCR was transformed by a multiplying by a factor of 10 for scale purposes. *Significant difference between LSO and HSO by Student t test (P<0.01). Different letters between the high-fat groups HSO and FO also indicates a significant difference by Student t test (P<0.01).