Figure 3.
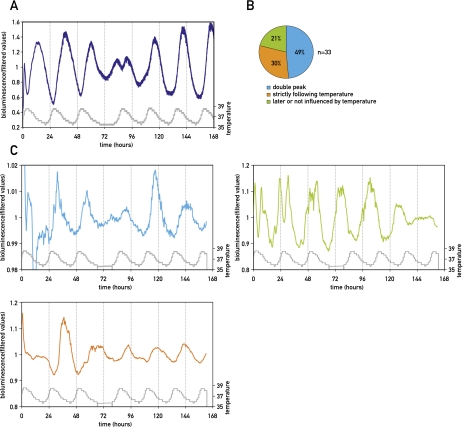
Bioluminescence microscopy of individual cells reveals different sensitivities to temperature cycles. (A) Bioluminescence monitoring of Bmal1-luciferase expression in NIH3T3 fibroblasts subjected to three temperature cycles, followed by a 12-h phase shift (gray curve) at the level of the whole population (dark blue) using photomultiplier tube technology for data acquisition, or at the single-cell level (three panels in C) using a LV200 luminoview microscope (Olympus) equipped with an EM-CCD cooled camera (Hamamatsu Photonics) (see the Materials and Methods). Three different patterns were observed in individual cells. The occurrence of each of them is quantified in B, and a representative example of each of them is shown in C. In the first case (turquoise), the cell was entrained by the initial phase, and this phase entered in conflict with the new phase, giving rise to a “double-peak phenotype.” In the second case (green), the cell kept its initial phase without responding to the new phase of the temperature cycle. In the third case (orange), the cell strictly followed the phase of the temperature cycles and immediately switched to the new phase. All bioluminescence data were filtered by moving average transformation (see the Materials and Methods).

