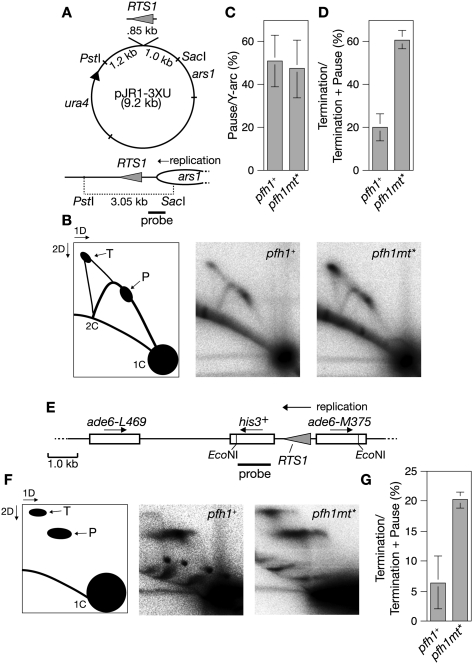
Figure 3.
Pfh1 promotes replication fork merging at the RTS1 RFB. (A) Schematic of plasmid pJR1-3XU containing RTS1 orientated so that it blocks the replication fork that approaches it from the right as drawn. The bottom panel shows a replication fork originating from ars1 moving toward RTS1 and the position of the probe used for the analysis in B. (B) 2D gel analysis of replication intermediates in the PstI–SacI fragment shown in A from pfh1+ and pfh1mt* cells. The schematic shows the position of the replication fork pause site (P) and the fork termination signal (T). (C) Amount of fork pausing (P) as a percentage of the total Y-arc. (D) Amount of terminating replication forks (T) as a percentage of the total fork pausing and termination (P + T). The data in C and D are mean values from the experiment in B and two further independent experiments. Error bars represent standard deviations. (E) Schematic of the ade6− direct repeat with intervening his3+ marker and RTS1. The arrows show the direction of gene transcription and replication as indicated. The position of the probe used for the analysis in F is also shown. (F) 2D gel analysis of replication intermediates in the EcoNI–EcoNI fragment shown in E from pfh1+ and pfh1mt* cells. The schematic shows the position of the replication fork pause site (P) and the fork termination signal (T). Note that the detection of replication intermediates at this single-copy chromosomal locus from asynchronously growing cultures necessitated greater quantities of DNA being loaded in each gel lane, which in turn resulted in a more smeared DNA signal than in the other 2D gels. (G) Amount of terminating replication forks (T) as a percentage of the total fork pausing and termination (P + T). The data in G are mean values from the experiment in F and two further independent experiments. Error bars represent standard deviations.

