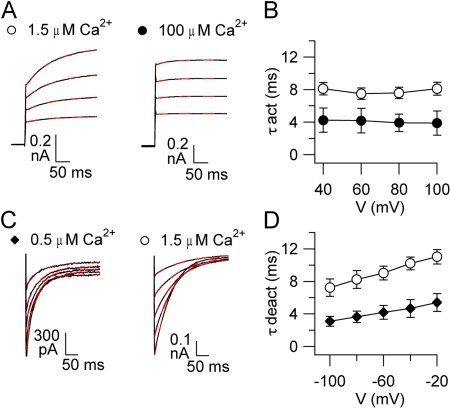
Figure 5.
Activation and deactivation kinetics of TMEM16B. (A) Representative recordings at the indicated [Ca2+]i. Voltage protocol as in Fig. 1 A, with voltage steps from a holding voltage of 0 between +40 to +100 mV in 20-mV steps. Red dashed lines are the fit to a single-exponential function. (B) Average activation time constants (τact) plotted versus voltage (n = 6–8). (C) Representative recordings at the indicated [Ca2+]i. Voltage protocol as in Fig. 1 C, with a prepulse to +100 mV and tail currents induced by voltage steps between −100 and +100 mV in 20-mV steps. Only tail currents are illustrated. Red dashed lines are the fit to a single-exponential function. (D) Average deactivation time constants (τdeact) plotted versus voltage (n = 4–9).

