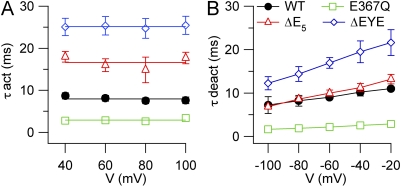
Figure 9.
Activation and deactivation kinetics of TMEM16B mutants. Kinetics were measured as explained in Fig. 5. (A) Average activation time constants (τact) plotted versus voltage for E367Q (n = 5), ΔE5 (n = 3), and ΔEYE (n = 6) mutants. (B) Average deactivation time constants (τdeact) plotted versus voltage for E367Q (n = 4), ΔE5 (n = 4), and ΔEYE (n = 5) mutants.

