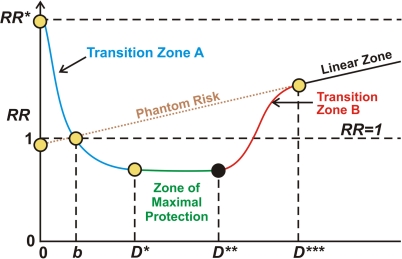
FIGURE 2.
Schematic representation of cancer relative risk (RR) under the hormetic relative risk (HRR) model. D is radiation dose or exposure level or exposure rate (for continuous lifetime exposure). The variable b is the natural background radiation level (residential radon excluded). RR = 1 at the natural background exposure level. RR* is the relative risk in the absence of any radiation exposure. The reference to phantom risk relates to use of the invalid linear-no-threshold LNT hypothesis to extrapolate from high to low radiation doses.

