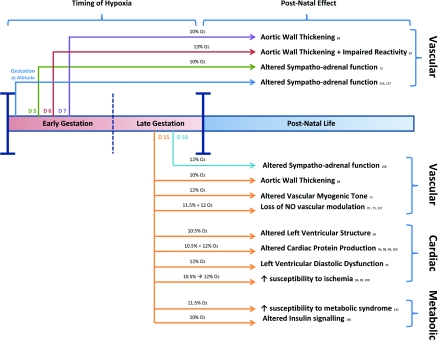
Figure 3. Cardiovascular changes associated with in utero exposure to hypoxia.
The major findings from studies (reference number given) considering the effects of pre-natal chronic hypoxia at different points of gestation on offspring cardiovascular physiology are outlined. The colour of the lines indicates the timing of commencement of in utero hypoxia; The dark blue line indicates hypoxia for the entire period of gestation, the green line from day 5, the red line from day 6, the purple line from day 7, the orange line from day 15, and the pale blue line from day 18 of gestation. The percentage of oxygen used in each study is indicated above the lines. Studies have been divided into those where hypoxia was commenced in early pregnancy (before day 10 in rat models or from conception in other animals) and those where hypoxia was commenced later in pregnancy. Studies later in pregnancy have demonstrated vascular, cardiac and metabolic alterations in the offspring. Fewer studies have considered the effects of early-onset hypoxia, but these have demonstrated similar findings in terms of the vascular phenotype.

