
Figure 3.
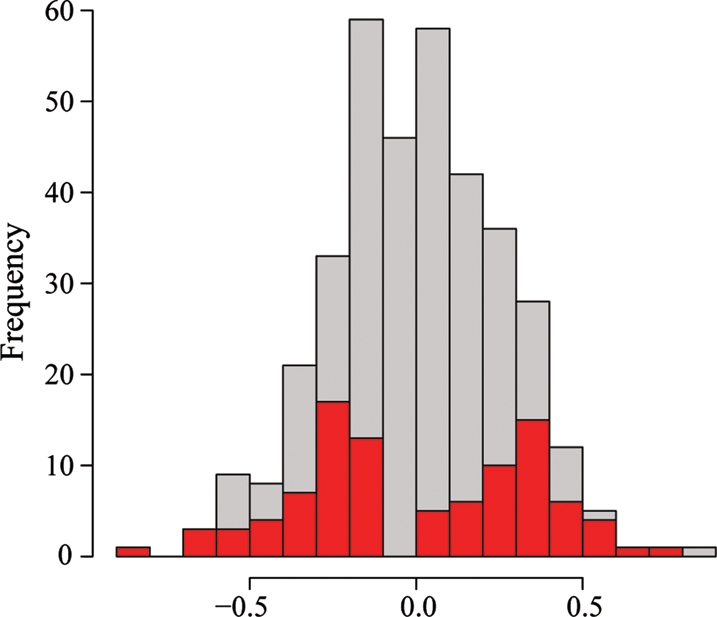
Choice of samples for the gene expression profiling study. A histogram of the distribution of lymphocyte counts (x-axis; the transformed residuals after correcting for age) for all available samples (gray bars) and for the 96 individuals chosen for the gene expression profiling study (red bars).