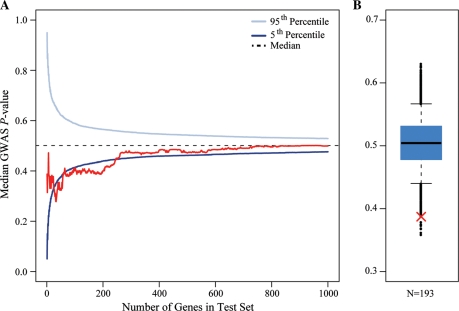
Figure 4.
Integrating the GWAS and gene expression profiling studies. (A) The median lymphocyte count GWAS P-value (y-axis) for an expanding window of genes is plotted in red. Genes are ordered by the strength of evidence supporting differences in expression level between individuals with low and high lymphocyte counts. The blue curves indicate the confidence interval for median P-values for random sets of genes at each test set size (based on 10 000 permutations). (B) A box plot of the distribution of median lymphocyte count GWAS P-values for random sets of 193 genes (based on 10 000 permutations). The whiskers extend to the 5th and 95th percentile. Black points indicate the observed medians outside this range. The red ‘X’ indicates the median P-value observed for the top 193 differentially expressed genes.

