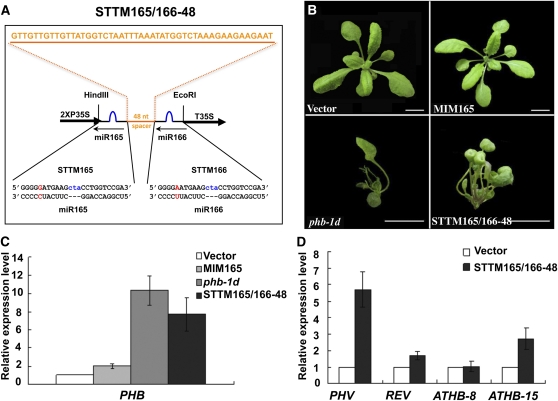
Figure 1.
STTM165/166-48 Induced Dramatic Alterations in Arabidopsis Development.
(A) Diagram of STTM165/166-48 structure showing the design strategy. Orange indicates the spacer region and the spacer sequence. Blue indicates the bulge sequences in the miRNA binding sites. Red indicates the nucleotides that are different between miR165 and miR166. nt, nucleotides.
(B) Phenotypes of 3-week-old STTM165/166-48 transformants compared with vector control (Columbia-0), MIM165, and phb-1d plants. phb-1d is a dominant genetic mutant of the PHB (AT2G34710) gene in the Landsberg erecta background, and this mutation abolishes the binding of miR165/166 to PHB mRNA. Bars = 1.0 cm.
(C) qRT-PCR analysis of the target gene PHB in STTM165/166-48 transformants compared with vector control, MIM165, and phb-1d plants. Bars show se.
(D) qRT-PCR analysis of selected targets of miR165/166 in STTM165/166-48 transformants. Bars show se.

