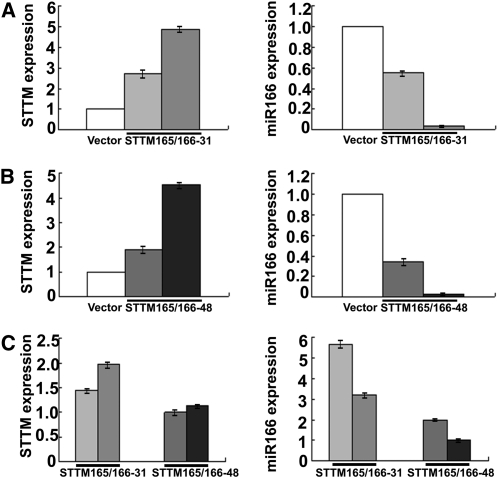
Figure 4.
Comparisons of STTM and miR166 levels in STTM165/166 Transformants with Different Spacer Lengths.
(A) qRT-PCR analysis of STTM and miR166 levels in independent STTM165/166-31 transgenic plants. Bars show se.
(B) qRT-PCR analysis of STTM and miR166 levels in independent STTM165/166-48 transgenic plants. Bars show se.
(C) Comparison of STTM and miR166 levels between independent STTM165/166-31 transgenic plants and independent STTM165/166-48 transgenic plants.
Transgenic plants used in (A) to (C) were independent lines. Actin mRNA (for STTM) or SnoR101 (for miRNA) was used as an internal control. Values were obtained by normalizing to Actin or SnoR101 and then comparing the normalized values to those of control plants. Different shades of gray are used to indicate different independent lines to allow for the easy comparison between STTM and miR165/166 levels in the same lines. Bars show se. Note: The vector controls also contain 2XP35S and T35S (see Supplemental Figure 7 online), which bind the common qRT-PCR primers for the quantification of STTM expression and thus gave a value by qRT-PCR.

