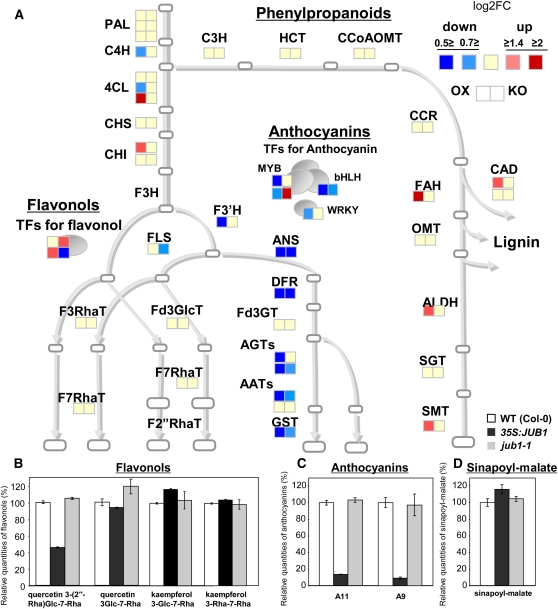
Figure 12.
Gene Expression Profiling of Phenylpropanoids, Flavonols, and Anthocyanins, and Metabolite Profiling of Related Secondary Metabolites in 35S:JUB1, jub1-1, and Wild-Type Plants.
(A) Expression of 33 enzymatic genes and six TFs as measured by qRT-PCR. Intensity of fold change against wild-type (WT) expression level (log2FC) is indicated by color. Abbreviations are given in Supplemental Table 2 online.
(B) to (D) The content of flavonols [quercetin-3-O-(2′′-O-Rha)Glc-7-O-Rha, quercetin-3-O-Glc-7-O-Rha, kaempferol-3-O-Glc-7-O-Rha, and kaempferol-3-O-Rha-7-O-Rha], anthocyanins (A11 and A9; Tohge et al., 2005), and sinapoyl-malate in 35S:JUB1, jub1-1, and wild-type plants was analyzed by LC-MS. Average of two biological replicates ± sd.

