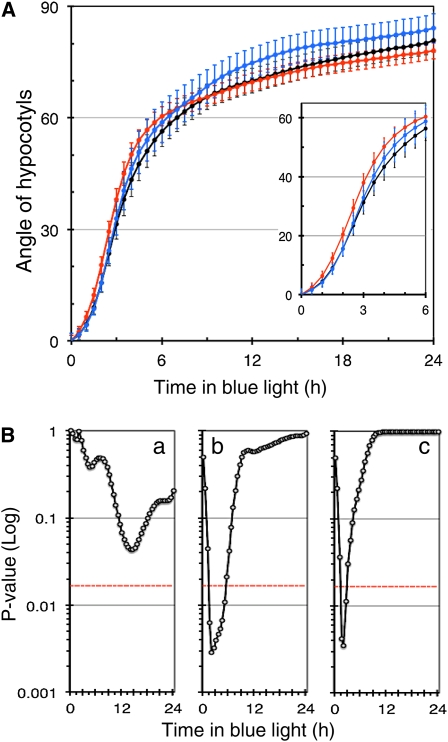
Figure 3.
phyA-NLS Seedlings Have a Faster Phototropic Response than Wild-Type and phyA-GFP Seedlings.
(A) Phototropism kinetics of seedlings grown as in Figure 2A (black, wild type; blue, phyA-GFP; red, phyA-NLS) analyzed using semiautomatic measurements (HypoPhen). The data are average values of both cotyledon positions ± 2 × se (n > 60) with the same number of cotyledons for each position.
(B) Analysis of a difference in phototropism kinetics for the data shown in (A). Data are represented as pairwise comparisons between the wild type versus phyA-GFP (a), the wild type versus phyA-NLS (b), and phyA-GFP versus phyA-NLS (c) for each time point. The P values resulting from a Student’s t test are represented. The red line represents the 5% threshold corrected for multiple testing.

