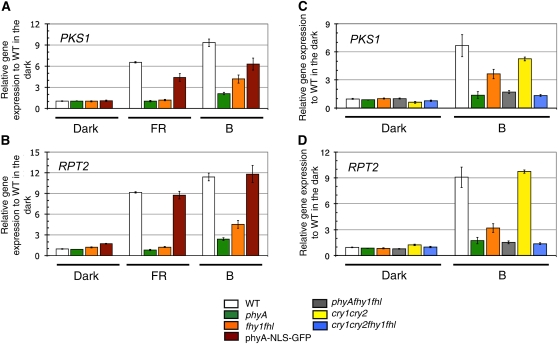
Figure 6.
A Blue Light Treatment Leads to Significant Induction of PKS1 and RPT2 Expression in fhy1 fhl.
(A) Expression of PKS1 was measured by qRT-PCR in the wild type (WT), phyA, fhy1 fhl, and phyA-NLS-GFP. The 3-d-old etiolated seedlings were either kept in the dark, exposed for 1 h to FR light (5 μmol m−2 s−1), or exposed for 1 h to blue light (B; 0.5 μmol m−2 s−1). Data are average expression of PKS1 normalized to two control genes and expressed relative to the wild type in the dark ± 2 × se. Averages from three biological replicates with three technical replicates for each are shown.
(B) Expression of RPT2 was performed as in (A).
(C) Expression of PKS1 was performed as in (A), but in the wild type, phyA, fhy1 fhl, phyA fhy1 fhl, cry1 cry2, and cry1 cry2 fhy1 fhl.
(D) Expression of RPT2 was performed as in (C).

