Figure 4.
CTL1-GFP Is Secreted to the Apoplast.
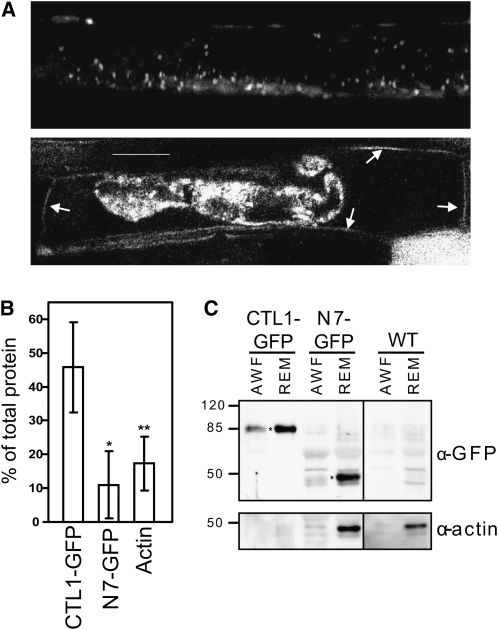
(A) CLSM image of CTL1-GFP root cell (top part) and root cell plasmolyzed using 0.5 M Suc for 45 min (bottom part). After plasmolysis, GFP signal observed in the cell wall is indicated by arrows.
(B) and (C) CTL1-GFP localized to the AWF and in the remaining material (REM). A GFP-tagged nuclear protein, N7-GFP, and actin were included as controls.
(B) Percentage of protein detected in the AWF, as a percentage of total protein AWF+REM. Data represent the average (±sd) of at least n = 2 (n = 4 for CTL1-GFP) independent immunoblots. Asterisks indicate significant changes in percentage of colocalization compared with control treatment (Student’s t test; *P < 0.05; **P < 0.01).
(C) Immunoblot summary of AWFs and REMs. Top panel, immunodetection of proteins in AWF and REM. Asterisks mark the specific bands of CTL1-GFP and N7-GFP. Bottom panel, immunodetection of actin in AWF and REM. The amount of protein loaded in CTL1-GFP AWF and REM was too little to detect actin. The same experiment was repeated three times with similar results. WT, wild type. Bar = 20 μm.

