Figure 7.
CTL1 and CTL2 Are Functionally Equivalent.
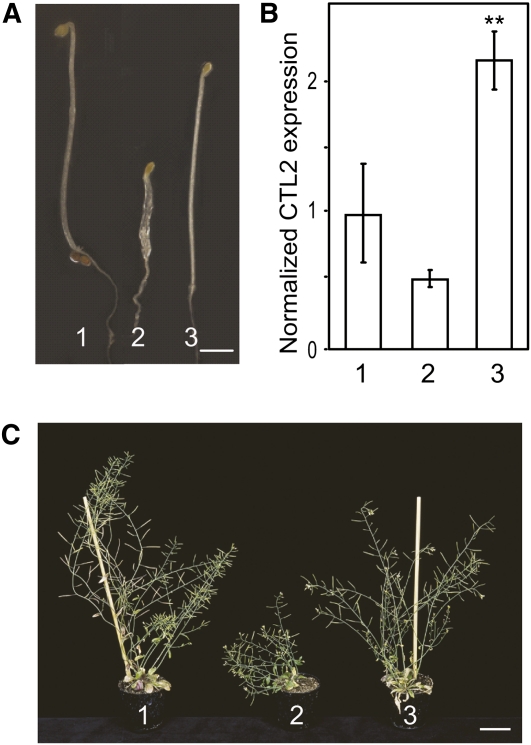
(A) and (C) pCTL1:CTL2 rescues the ctl1-1 mutant phenotype in 6-d-old etiolated seedlings (A) and 7-week-old plants (C). Bars = 1 mm in (A) and 5 cm in (C).
(B) Relative quantification of CTL2 levels in 6-d-old etiolated seedlings. Values are represented as n-fold CTL2 cDNA levels compared with the wild type. Data represent the average (±se) of n = 3 biological replicates, each containing three technical repetitions. Asterisks indicate significant changes in relative CTL2 expression compared with the wild type (Student’s t test; P < 0.01). 1, the wild type (Col-0); 2, ctl1-1; 3, ctl1-1 complemented with PCTL1:CTL2.

