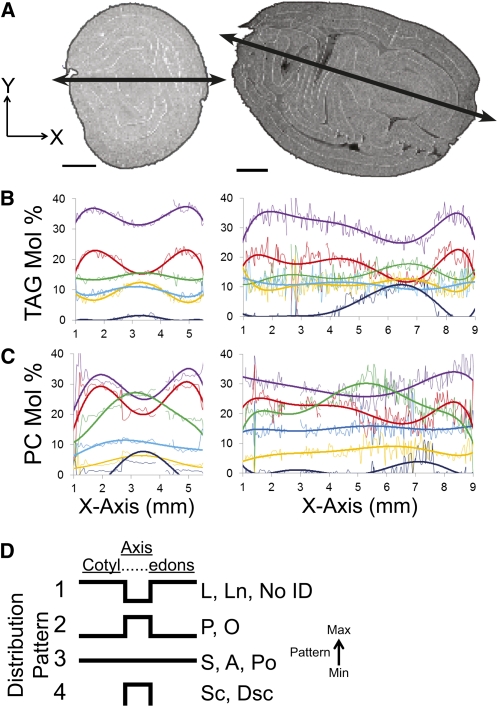
Figure 10.
Distribution of TAG, PC, and Corresponding FA Species across MALDI-MSI Sections.
(A) TIC distribution of cross and longitudinal sections. The line drawn through the sections represents the set of x, y coordinates analyzed for their TAG and PC relative molecular distributions (i.e., each pixel traversed across will have a MALDI-MSI spectrum associated with it). Bars = 1 mm.
(B) Distribution of selected TAG species across the center of the cross-section plotted relative to their x axis location. Thin lines represent the individual mol % values at that x, y position for a particular species (purple, TAG-52:4 PLL; red, TAG-54:6 LLL; green, TAG-50:2 PPL; yellow, TAG-52:3 PLO; light blue, TAG-54:5 LLO; dark blue, combined sterculic/dihydrosterculic cyclic TAGs). Thick lines represent a polynomial fit using Microsoft Excel to aid visualization of changes across the section.
(C) Distribution of selected PC species across the center of the cross section plotted relative to their x axis location. Thin lines represent the individual mol % values at that x, y position for a particular species (purple, PC-34:2 PL; red, PC-36:4 LL; green, PC-36:3 LO; yellow, PC-36:2 LS/OO; light blue, PC-34:1 PO; dark blue, combined sterculic/dihydrosterculic cyclic PCs). Thick lines represent a polynomial fit using Microsoft Excel to aid visualization of changes across the section.
(D) Summary of FA distribution patterns relative to their mol % contribution of the cross and longitudinal sections. Four distinct distributions patterns were present throughout the seed sections. Pattern strokes represent relative abundances for identified FAs: P-16:0, palmitic; Po-16:1, palmitoleic, Ln-18:3, linolenic; L-18:2, linoleic; O-18:1, oleic acid; S-18:0, stearic, A-20:0: arachidic; Sc-19:1 sterculic acid; Dsc-19:0-dihydrosterculic acid; as well as those without identification (No ID).

