Figure 3.
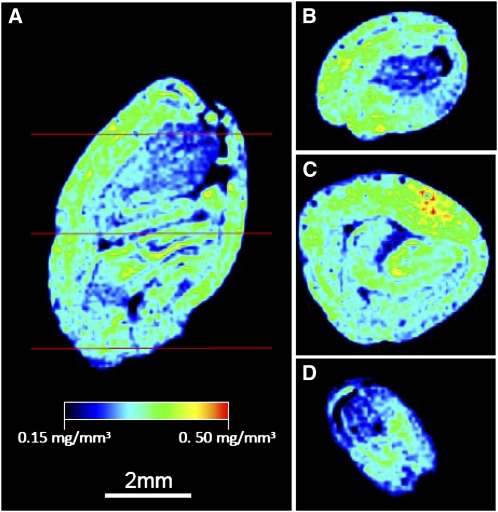
Distribution of Total Seed Lipid Content by NMR.
(A) Longitudinal representation of total seed lipids within an intact embryo. See Supplemental Movie 1 online for complete profiling of intact embryo.
(B) to (D) Representative cross-section profiles through the chalazal (B), middle (C), and micropylar (D) sections of the intact embryo.

