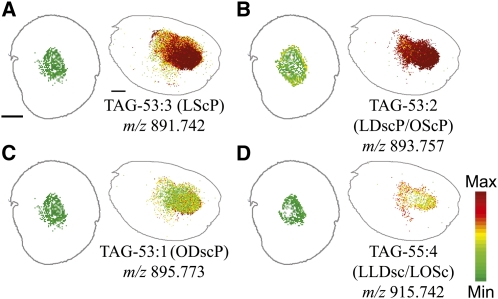
Figure 5.
Distribution of TAG Molecular Species Containing Sterculic and/or Dihydrosterculic (Cyclic) Fatty Acids.
Distribution of selected cyclic TAG molecular species in mol %. Ion counts within ± 0.02 m/z units of each sodiated [M + Na]+ (labeled on figure) and potassiated [M + K]+ monoisotopic masses are normalized to the total TAG ion signals on each pixel. A red-green linear color scale is used with maximum mol % value corresponding to 3% of total TAG for all images. See Supplemental Table 1 online for all cyclic TAG species identified and m/z analysis for each species. Bar = 1 mm.

