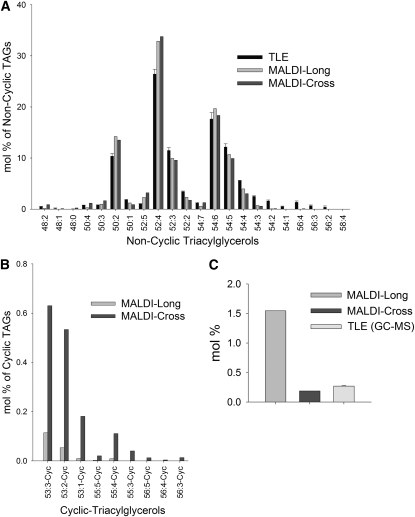
Figure 6.
Comparison of TAG Molecular Species Profiles at Different Spatial Resolutions.
(A) Individual noncyclic TAG species were quantified as mol % of total TAG content: (1) at tissue resolution – TLE of mature embryos sampled through direct-infusion ESI-MS (n = 3); or (2) at cellular resolution – MALDI-MSI longitudinal and cross sections. These data are in agreement with results from DOMS of small lipid droplet populations (n = 3 sets of 10 to 25 lipid droplets) (Horn et al., 2011a). See Supplemental Table 1 online for all noncyclic TAG species identified and m/z analysis for each species.
(B) Mol % distribution of TAGs with one or more acyl cyclic FAs (sterculic and/or dihydrosterculic) normalized to total TAG content in MALDI-MSI sections. See Supplemental Table 1 online for all cyclic TAG species identified and m/z analysis for each species.
(C) Comparison of total 19C cyclics quantified by MALDI-MSI and GC-MS. For MALDI sections, 19C cyclic TAGs (sterculic + dihydrosterculic) were normalized to total TAG content. For GC-MS analysis, TLEs were converted to FAMEs with total 19C cyclic FAs (sterculic + dihydrosterculic) normalized to total FA content (n = 3). See Supplemental Figure 2 online for total FA composition quantified by GC-MS.

