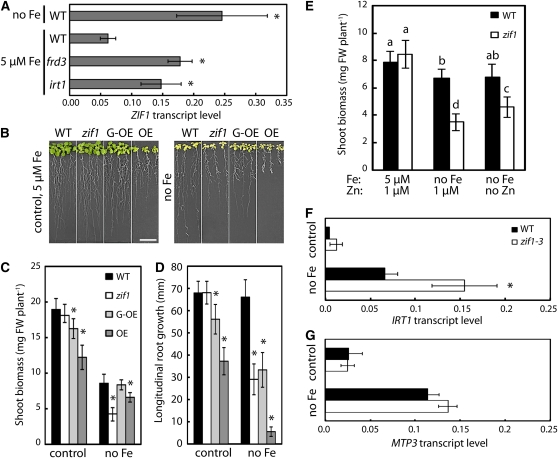
Figure 4.
Loss of Function or Overexpression of ZIF1 Are Both Detrimental to Plant Performance under Fe Deficiency.
(A) Transcript levels of ZIF1, relative to UBQ10, in shoots of 17-d-old Col (wild type [WT]), frd3-1, and pam25 (irt1) seedlings grown on control media and the wild type grown on Fe-deficient (no Fe) media for 7 d, determined by qRT-PCR (mean ± sd, n = 3).
(B) to (D) Photographs (B), shoot biomass (C), and root growth (D) of 17-d-old Col, zif1-3, 35S-ZIF1-GFP (G-OE), and 35S-ZIF1 (OE) seedlings after 7 d growth on control or Fe-deficient (no Fe) media (mean ± se, n = 4). FW, fresh biomass. Bar = 10 mm.
(E) Shoot biomass of 17-d-old Col and zif1-3 seedlings after 7 d growth on control or Fe-deficient (no Fe) media with or without 1 μM Zn (mean ± se, n = 3).
(F) and (G) IRT1 (F) and MTP3 (G) transcript levels, relative to UBQ10 and ACT2, in roots of 14-d-old Col and zif1-3 seedlings grown on control media or Fe-deficient media for 3 d, determined by qRT-PCR (mean ± sd, n = 3).
Asterisks denote significant differences from the wild type in (A), (C), (D), (F), and (G), and different letters (E) denote pairwise differences, by Student’s t test (P < 0.05) with Bonferroni corrections.
[See online article for color version of this figure.]

