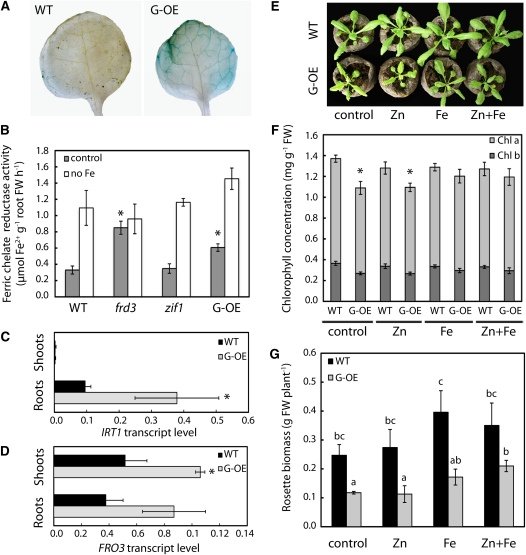
Figure 5.
Fe Homeostasis Defects of ZIF1-Overexpressing Plants.
(A) Perls’ stain for ferric Fe in Col (wild type [WT]) and 35S-ZIF1-GFP (G-OE) leaves of 35-d-old soil-grown plants.
(B) Root surface ferric-chelate reductase activity of 17-d-old Col, frd3-1, zif1-3, and 35S-ZIF1-GFP seedlings after 7 d growth on control or Fe-deficient (no Fe) media (mean ± sd, n = 4). FW, fresh biomass.
(C) and (D) IRT1 (C) and FRO3 (D) transcript levels, relative to UBQ10, in shoots and roots of 21-d-old Col and 35S-ZIF1-GFP seedlings grown on control media, determined by qRT-PCR (mean ± sd, n = 3).
(E) to (G) Photographs (E), leaf chlorophyll concentration (F), and shoot biomass (G) of soil-grown 27-d-old Col and 35S-ZIF1-GFP plants after 2 weeks of spraying with control (0.05% [v/v] Tween 20), 1 mM ZnSO4, and/or 0.5 g L−1 Fe-EDDHA every 3 to 4 d (mean ± sd, n = 4).
Asterisks in (B) to (D) and (F) denote significant difference from the wild type by Student’s t test with Bonferroni corrections (P < 0.05). Different letters in (G) indicate pairwise significant differences by Student’s t test with Bonferroni corrections (P < 0.05).

