Figure 2.
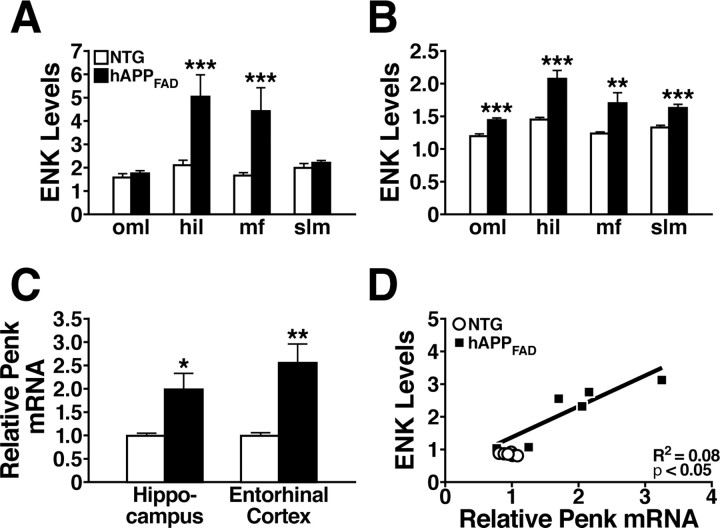
Quantitative comparison of hippocampal ENK and Penk expression in hAPPFAD mice and NTG controls. A, B, Densitometric quantitation of ENK immunoreactivity in specific hippocampal subregions (normalized to values from the stratum radiatum of CA1) from sections of 2- to 4-month-old (A) and 6-month-old (B) mice. n = 10–14 mice per age and genotype. C, Quantitative RT-PCR analysis of Penk mRNA levels in the hippocampus of 2- to 3-month-old mice and in the entorhinal cortex of 4- to 6-month-old mice relative to NTG controls. n = 6 (hippocampus) or 11–15 (entorhinal cortex) mice per age and genotype. D, In 2- to 3-month-old hAPPFAD mice, ENK immunoreactivity levels in the hilus correlated with hippocampal Penk mRNA levels. R2 and p values refer to hAPPFAD mice only. *p < 0.05, **p < 0.01, ***p < 0.001 versus NTG (Student's t test). Values are mean ± SEM.

