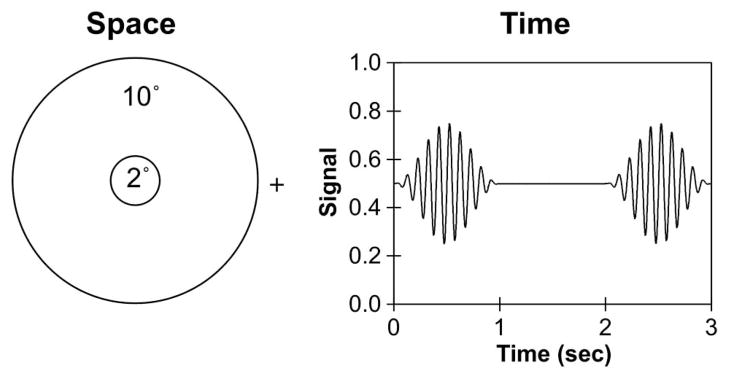
Fig. 1.
Spatial configuration and temporal profile of stimuli used for CFF measurements. The left panel shows a 2° central field set within a 10° surround. A fixation placed the stimuli at 6.0° temporal eccentricity. The right panel shows an example of a 10 Hz signal that was modulated sinusoidally in the center field within a 1 s raised cosine envelope that was alternated with a 1 s steady center field.

