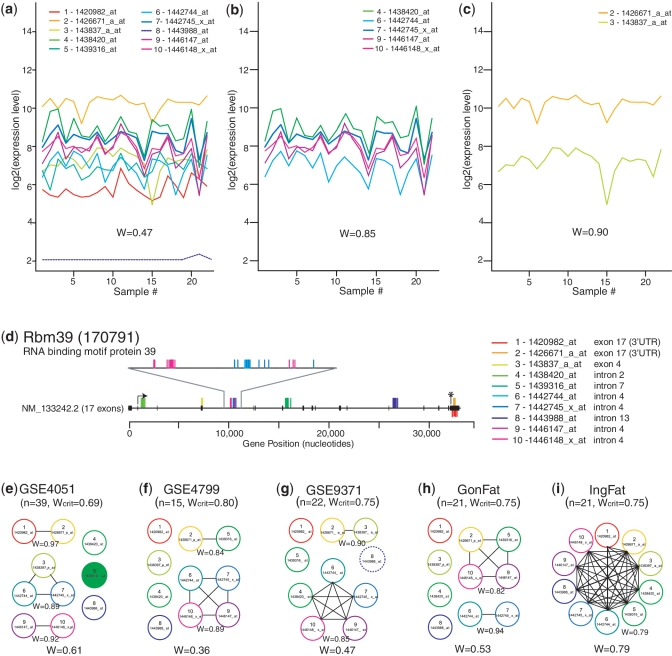
Figure 4.
Graphical analysis of probe sets annotated as representing Rbm39 (encoding RNA binding motif protein 39) from multiple experiments performed on the Mouse 430 2.0 GeneChip®. (a–c) Expression profiles of probe sets across the 22 samples in the GSE9371 data set; W indicates level of concordance. (a) All 10 probe sets; W shows lack of concordance. A dotted line shows a probe set removed by gene filtering (for very low expression or very low variance) and therefore not included in the calculation of W. (b) The largest subgroup includes probe sets 4, 6, 7, 9 and 10; W shows high concordance. (c) The second subgroup includes probe sets 2 and 3; W shows high concordance. (d) Mapping of the 10 probe sets to the genomic sequence of Rbm39 and the exons of its only known transcript. Probes mapped above the line map to the coding (negative) strand, those below the line map to the non-coding (positive) strand. (e–i) Connected subgraphs indicating groups of concordant probe sets in five different experiments. In parentheses are the number of samples in each data set (n) and the critical value for W for a data set of that size. W is given for each group as a whole (bottom) and for each concordant subgroup (below each subgroup). Filled circles indicate statistically significant differential expression in that experiment. A dotted circle indicates a probe set removed during gene filtering in that data set.

