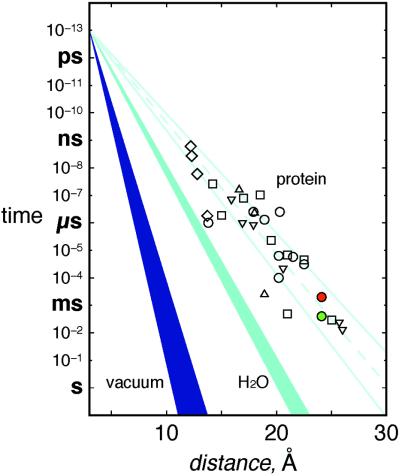
Figure 5.
Tunneling timetable for ET in Ru-modified proteins (open symbols), water (light blue, β = 1.61–1.75 Å−1), and vacuum (dark blue, β = 3.0–4.0 Å−1) (adapted from ref. 36). Most coupling-limited electron tunneling times in proteins [cyt c (○); azurin (▿); cyt b562 (□); myoglobin (▵); and high-potential iron–sulfur protein (⋄)] fall in the 1.0- to 1.2-Å−1 wedge (pale blue solid lines; pale blue dashed line is the average β of 1.1 Å−1). Colored circles (*Zn-cyt c → Fe(III)-cyt c, green and Fe(II)-cyt c → Zn-cyt c+, red) are interprotein time constants.

