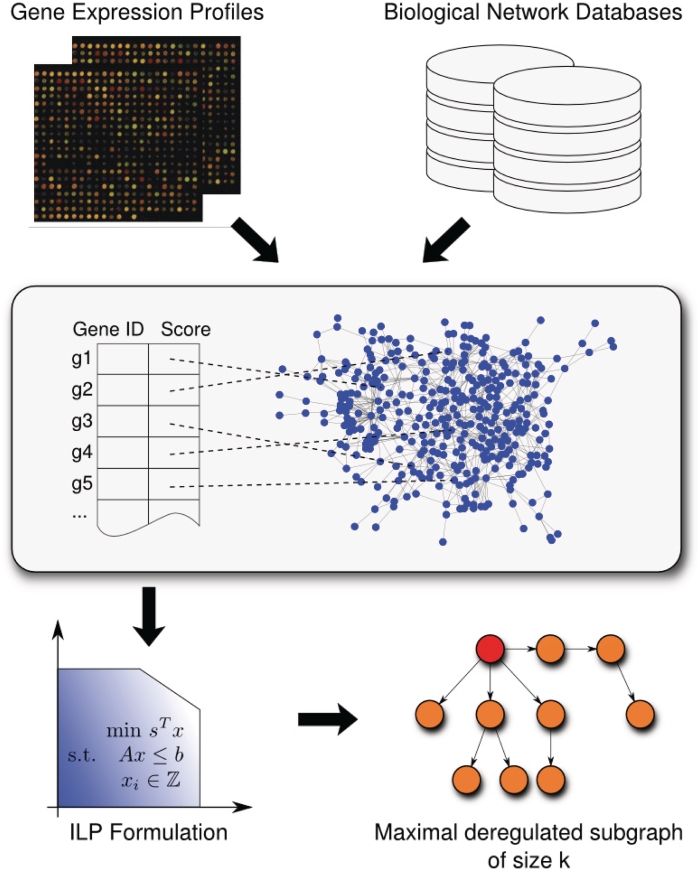
Figure 1.
Workflow of our algorithm for the computation of deregulated subgraphs. As input, it requires a biological network and a list of genes with scores that have been derived from expression data and mirror the degree of deregulation. After the scores of the genes have been mapped to the corresponding nodes of the network, our ILP-based B&C approach calculates the most deregulated subgraph that can be visualized using BiNA (23).

