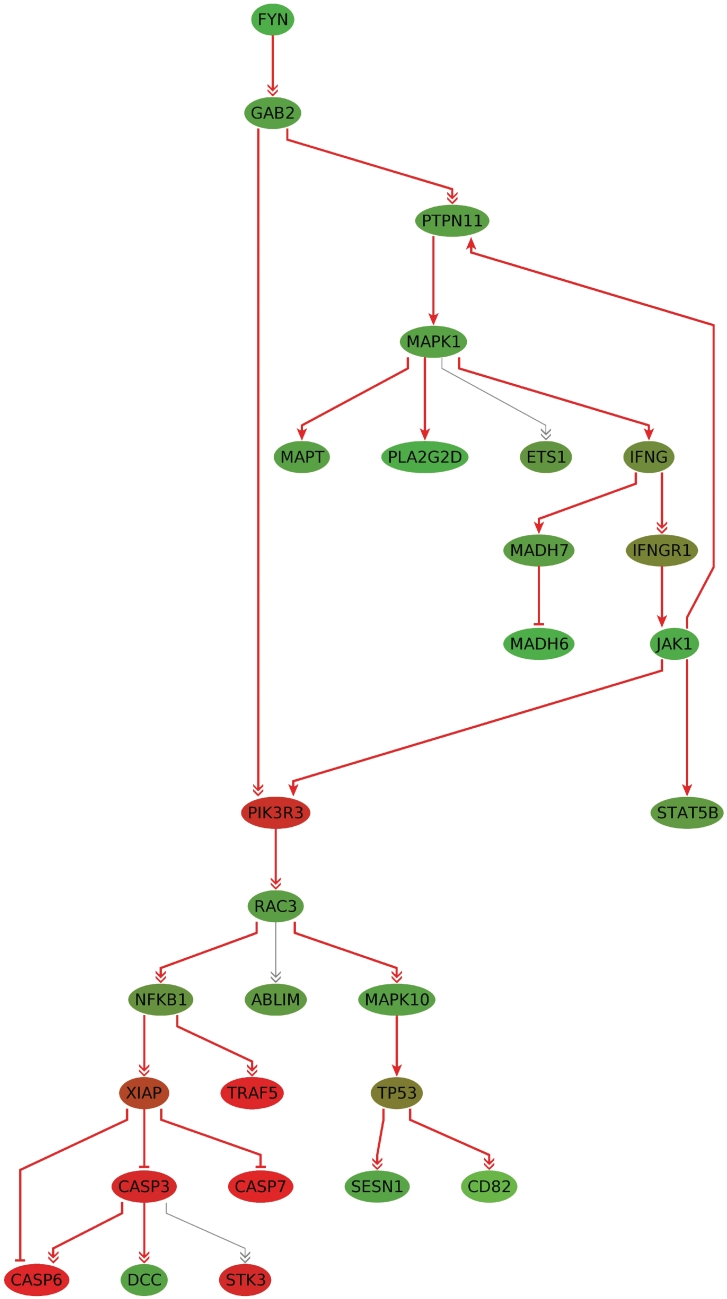
Figure 4.
The subgraph of size k = 25 for the glioma dataset. The nodes connected by gray edges are part of the union network of the deregulated subgraphs of size 10–25. The nodes are colored by the computed scores (t-test test statistic values), where shades of green correspond to downregulated and shades of red correspond to upregulated genes. The more intense the color, the higher the level of deregulation.

