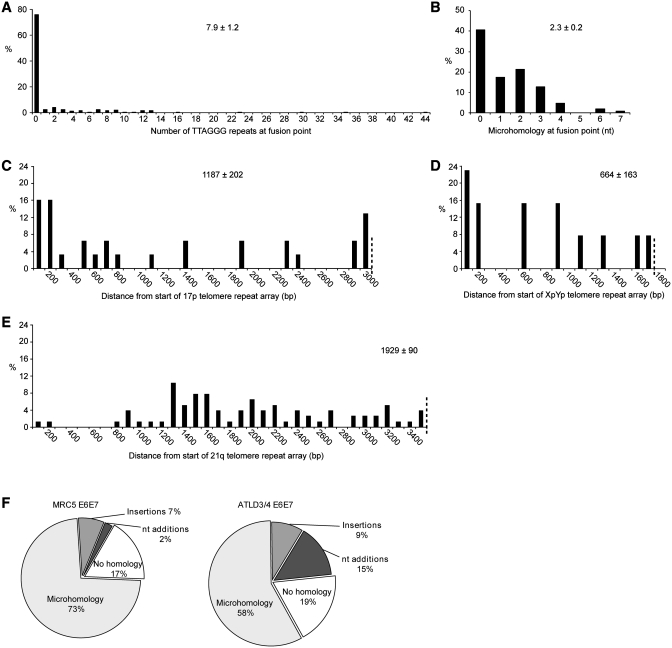
Figure 2.
Illustrating the mutational profile that accompanies telomere fusion in ATLD 3/4 cells. (A) The frequency of TTAGGG repeats at the fusion point. (B) Micro-homology at the fusion point. (C–E) Representing the distance of sub-telomeric deletion from the start of the telomere repeat arrays of 17p, XpYp and 21q. The extent of sub-telomeric deletion that can be detected with the assays is indicated by a dotted line across the x-axis. The means ± standard error are indicated on each panel. (F) Pie chart displaying the proportions of telomere fusion events displaying sequence homology, nucleotide insertions and identifiable insertions at the fusion point in MRC5 and ATLD 3/4 cells.

