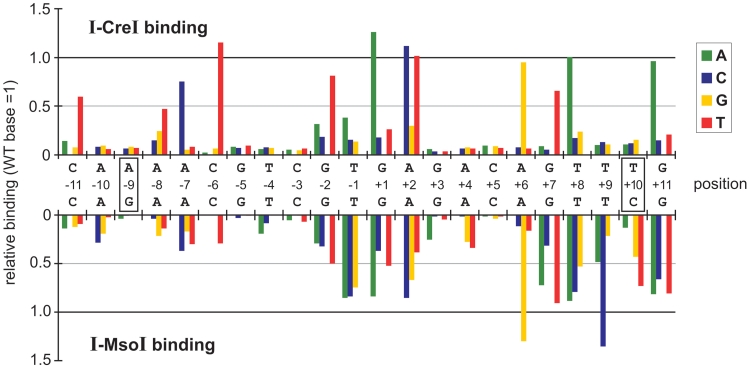
Figure 2.
In vitro binding specificity profiles of I-CreI and I-MsoI. The relative binding affinities of I-CreI (top) and I-MsoI (bottom) for all 4 bp at each target site position were determined using a competitive in vitro binding assay (20). Target site base pair numbering is as in Figure 1, with positions differing between I-CreI and I-MsoI shown in boxes (−9 and +10 positions). Bar heights indicate the binding affinity of each protein for base pair substitutions relative to binding of the native base pair whose binding has been arbitrarily set as 1.0. All results are the mean of three replications in which the standard deviation between experiments was ±5%. Error bars have been omitted for graphical clarity.

