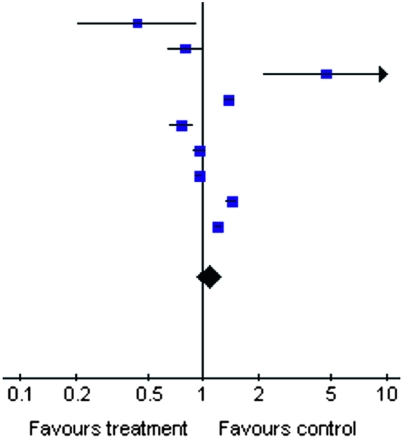
Table 2.
Summary estimate for unadjusted ORs of reduced estimated GFR according to anti-HCV serologic status
| Study or Subcategory | Anti-HCV Positive (n/N) | Anti-HCV Negative (n/N) | OR (Random) (95% CI) | Weight (%) | OR (Random) (95% CI) |
|---|---|---|---|---|---|
| Tsui et al.(22) | 7/366 | 630/14,663 |  |
3.35 | 0.43 (0.20, 0.92) |
| Dalrymple et al.(23) | 93/1928 | 1423/23,854 | 11.27 | 0.80 (0.64, 0.99) | |
| Tsui et al.(24) | 10/52,874 | 17/421,495 | 3.16 | 4.69 (2.15, 10.24) | |
| Tsui et al. (retrospective) (24) | 760/52,874 | 4383/421,495 | 13.79 | 1.39 (1.28, 1.50) | |
| Moe et al.(25) | 248/3938 | 745/9201 | 12.66 | 0.76 (0.66, 0.89) | |
| Asrani et al.(27) | 682/13,384 | 8172/154,185 | 13.76 | 0.96 (0.89,1.04) | |
| Asrani et al. (retrospective) (27) | 3677/8063 | 37,957/80,759 | 14.10 | 0.95 (0.90, 0.99) | |
| Lee et al.(26) | 1066/5683 | 6872/49,283 | 13.86 | 1.42 (1.33, 1.53) | |
| Butt et al.(28) | 3140/18,002 | 3738/25,137 | 14.05 | 1.21 (1.15, 1.27) | |
| Total | 157,112 | 1,200,072 | 100.00 | 1.07 (0.92, 1.25) | |
| Total events | 9683 | 63,937 |
Test for heterogeneity: Chi square=201.96; df=8 (P<0.00001); I2=96.0%. Test for overall effect: Z=0.86 (P=0.39). OR, odds ratio; HCV, hepatitis C virus; NHANES, National Health and Nutrition Examination Survey; 95% CI, 95% confidence interval.
