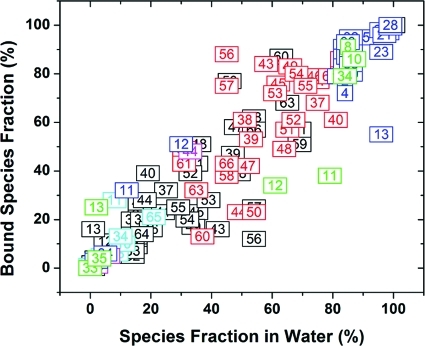
Figure 5.
A comparison of predicted bound species prevalences and species fractions in the aqueous solution for studied ligands (the numbers correspond to the compound numbers in Tables 1 and 2). Species 1–6 (Schemes 1 and 2) are referred to by black, cyan, red, magenta, blue, and green colors, respectively. Only major species (at least one compound with >10%) are shown here.

