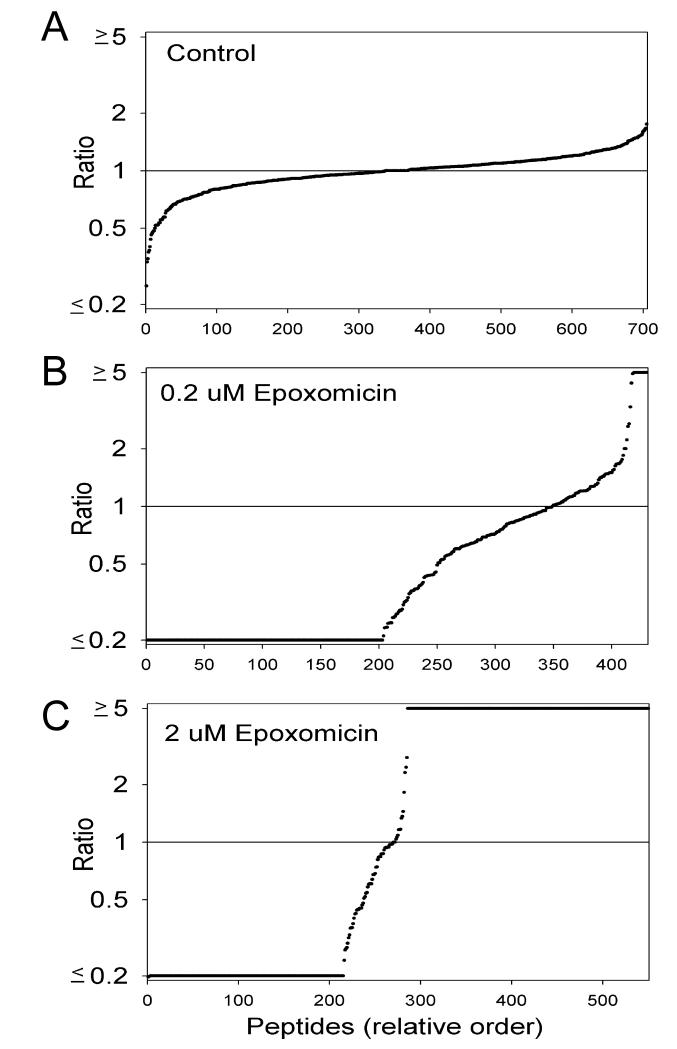
Figure 1. Analysis of the peptidome of HEK293 cells.
The relative level of every peptide, both identified and unidentified by MS/MS analysis, was calculated for each of the replicates and expressed relative to the average level of the peptide in the two replicates of untreated cells. Then, the relative level was sorted from low to high and plotted on the y-axis; for these plots, the x-axis represents the rank order of each peptide when sorted by the relative level. Peptides only present in the epoxomicin-treated cells and not detected in the control cells were listed with a ratio of ≥5, and those peptides only present in the control cells and not detected in the epoxomicin-treated cells were listed with a ratio of ≤0.2. For this analysis, if a peptide was detected with two different charge states, each value is indicated separately. A: The ratio of each control replicate was expressed versus the average of the controls. B: The ratio of cells treated for 1 hour with 0.2 μM epoxomicin, relative to the average of the untreated control cells. C: The ratio of cells treated for 1 hour with 2 μM epoxomicin, relative to the average of the untreated control cells.

