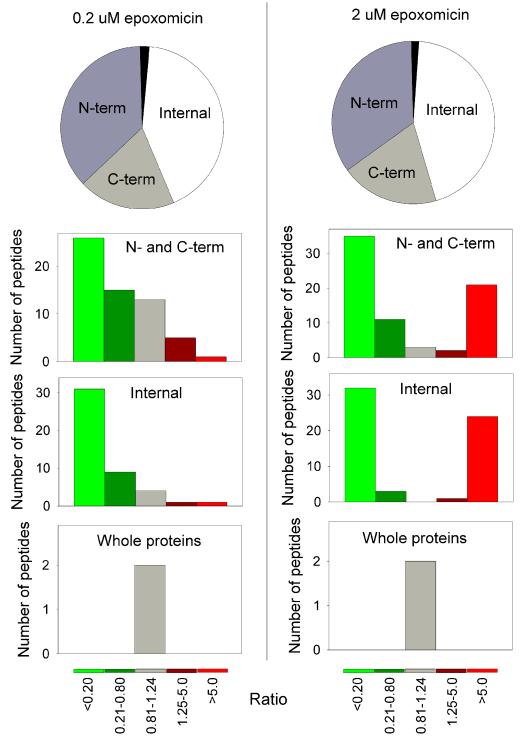
Figure 3. Location of the peptide within the protein, and influence of epoxomicin on the levels of each subgroup of peptides.
The pie graphs show the fraction of peptides representing N-terminal (N-term), C-terminal (C-term), or internal fragments of the precursor protein. The black slice represents the two small proteins detected in this analysis (thymosins) that do not require cleavages. For each group, the effect of epoxomicin on peptide levels is indicated, using the coloring scheme shown at the bottom of the figure. The y-axes show the number of peptides detected for each of these groups, and with the indicated ratio for the epoxomicin versus untreated cells.

