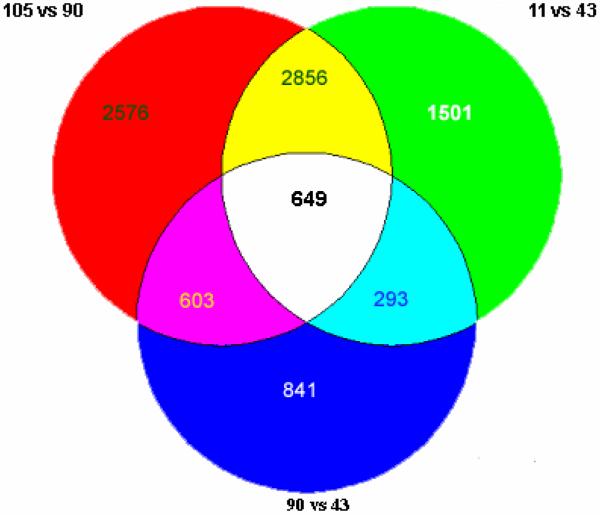
Fig. 2.
Venn diagram of gene expression, when the control was compared with the DDC treated mice or the mouse fed DDC 10 wk and then DDC withdrawn for 5 weeks. The change in gene expression in the same direction shared by the DDC treated mice numbers 625 with 25 odd. 90 vs. 43= 2300 genes changed. 11 vs. 43= 5300 genes changed. 105 vs. 90= 6600 genes changed. 649 genes were changed in common among the three different comparisons, which includes 9319 genes in total (n=1).

