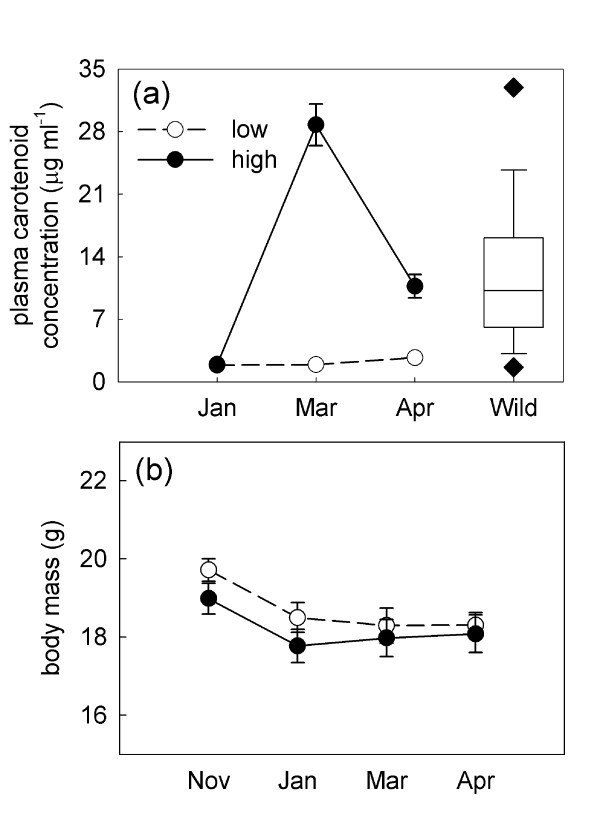
Figure 1.
Female plasma carotenoid levels and body mass throughout the diet manipulation. (a) Mean ± s.e. plasma carotenoid concentrations of the high- and low-carotenoid diet female house finches throughout the study. Carotenoid supplementation began after the first sample was obtained (Jan.), and the mate choice tests were carried out in the period between the Mar. and Apr. samples. The box plot represents that carotenoid levels of wild female plasma measured in Jan.-Apr. 2005 and 2006 ([44], McGraw unpublished data) and is given for comparison. (b) Body mass of the high- and low-carotenoid finches at capture (Nov.) and throughout the study. Open symbols represent the low-carotenoid females and closed symbols represent the high-carotenoid females.

