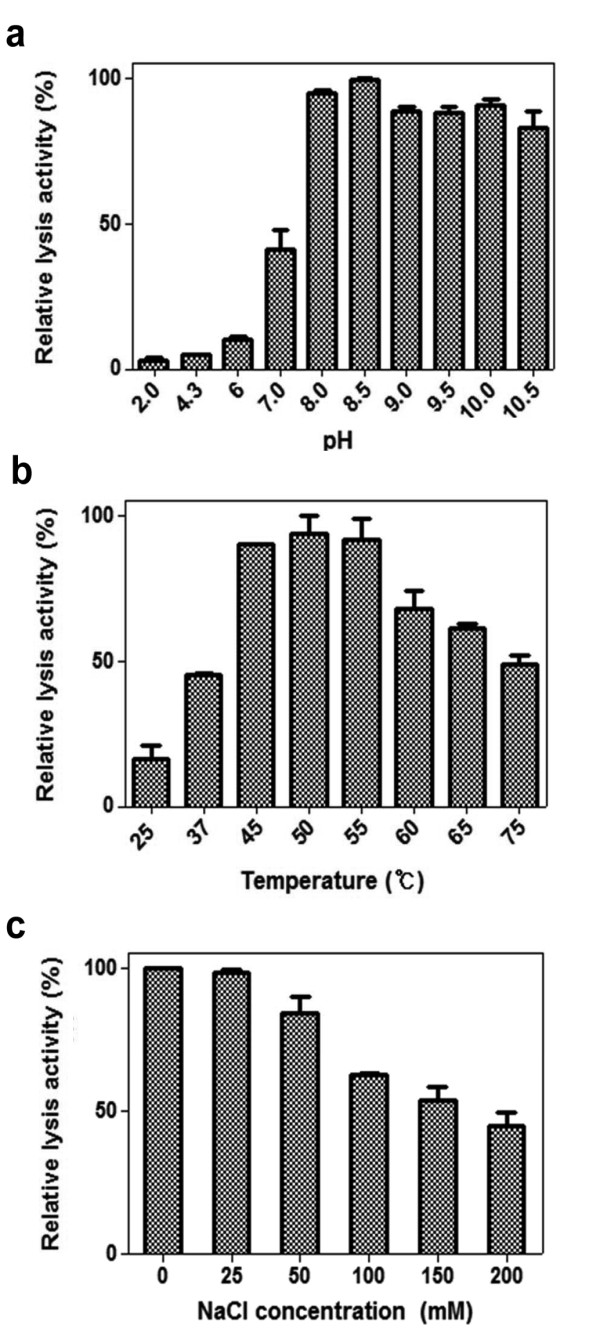
Figure 3.

Effect of pH, temperature, and NaCl on the lytic activity of LysB4. The effect of pH (a), temperature (b), and NaCl concentration (C) on the lytic activity of LysB4 against B. cereus ATCC 10876 cells was shown. Relative lytic activity was obtained by comparing the lytic activity of each test with the maximal lytic activity among the dataset. Each column represents the mean of triplicate experiments, and error bars indicate the standard deviation.
