
Figure 3.
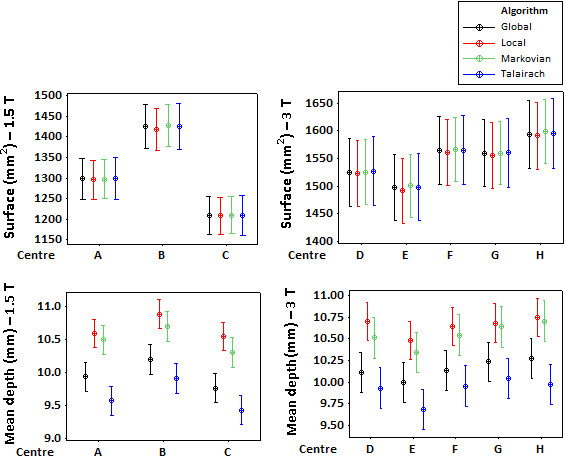
The mean and 95% confidence interval of the sulcal parameters. The mean (the average of all subjects, visits, and sulci) and the 95% confidence interval of the sulcal surface (top) and mean geodesic depth (bottom), calculated for each centre using all sulci recognition algorithms are shown for the 1.5 T group (left) and the 3 T group (right). Mean geodesic depth refers to the average geodesic depth across a given sulcal label (note that the depth a sulcus is usually non-uniform throughout its length and hence the mean value is used). The values are calculated for each hemisphere independently and the plots show the values associated with both hemispheres. The statistical results corresponding to this figure can be found in table 5.