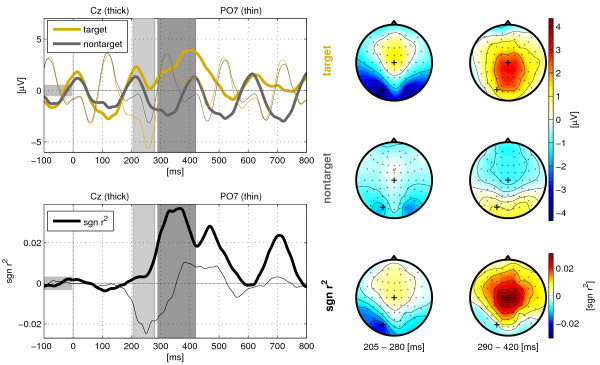
Figure 4.
Event-Related Potentials. Grand-average of the event-related potentials for target and non-target conditions in the Center Speller experiment. The top plot on the left shows the voltage trace at electrode Cz (thick line) and PO7 (thin line) for the target (orange) and the non-target (dark gray) condition, the bottom plot shows the time evolution of the sgn r2 values indicating the target/non-target class difference at those electrodes. The average voltages and sgn r2 values of the two intervals (indicated by the gray patches), are shown as scalp topographies on the right side.

