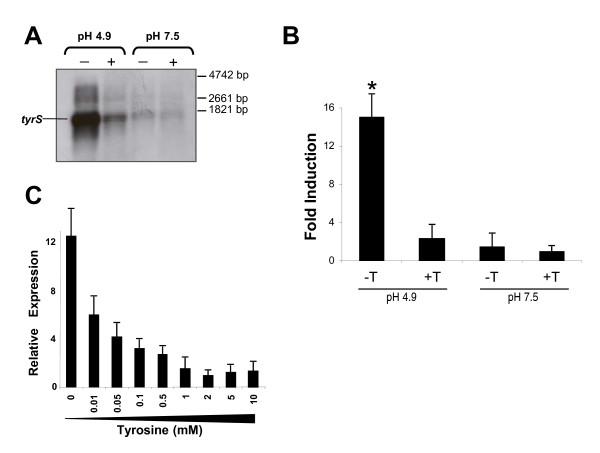
Figure 1.
Transcriptional analysis of the tyrS gene. A: Northern blot analysis with a tyrS-specific probe and B: RT-qPCR quantification of tyrS mRNA levels in presence (+Y) and absence (-Y) of 10 mM tyrosine and different pH conditions (pH 4.9 and pH 7.5). The asterisk indicates statistically significant difference (p ≤ 0.005; Student's t-test) in comparison to the other conditions. C: Effect of different tyrosine concentrations (0, 0.01, 0.05, 0.1, 0.5, 1, 2, 5 and 10 mM) on tyrS expression at pH 4.9

