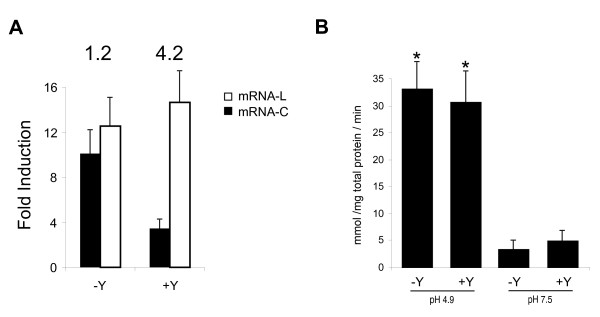
Figure 4.
Regulatory effect of the Tbox on tyrS expression. A: Quantification of tyrS mRNA-C (in black) and mRNA-L (in white) levels at pH 4.9 in presence (+Y) and absence (-Y) of 10 mM tyrosine. Numbers above indicate the ratio mRNA-L/mRNA-C in the corresponding condition. B: Effect of Tbox deletion on β-Galactosidase activity of PtyrSΔ-lacZ fusions at different conditions of pH and presence/absence of 10 mM tyrosine (Y). Data represent the average of three independent experiments. The higher activity observed at pH 4.9 (asterisks) was statistically significant (p < 0.005; Student's t-test) in comparison to that at pH 7.5

