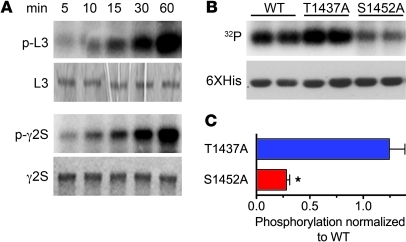
Figure 4. Identification of PKCε phosphorylation sites in the L3 loop.
(A) The top 2 panels show an autoradiogram of phosphorylated intracellular L3 loop (p-L3) and a scanned image of a Coomassie blue–stained gel before autoradiography (L3). The bottom 2 panels are an autoradiogram and gel of PKCε phosphorylation of the large intracellular loop of the GABAA γ2 subunit (p-γ2s), a known PKCε substrate (9). (B) An autoradiogram and Western blot with anti-6xHis antibody, showing that PKCε phosphorylation of the NaV1.8 L3 loop was substantially reduced by alanine substitution at S1452 but not at T1437. (C) Quantification of L3 loop phosphorylation by PKCε. Results were calculated as the ratio of optical density values for phosphorylation (determined by autoradiography) and immunoreactivity (determined by Western blot analysis with anti-6xHis antibody) and were normalized to values obtained for native L3 loop run in parallel (mean ± SEM values from 3 experiments). *P = 0.0002 compared with a theoretical mean of 1.0 by 1-sample t test.

