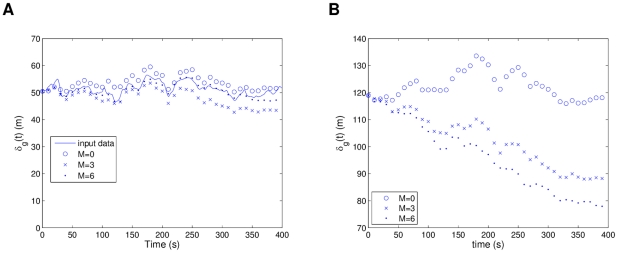
Figure 10. Homing flight 4: Flock separation for models with different interaction structure.
In (a), simulations consider initial conditions from the input data, while (b) averages over ten simulations of random initial conditions. From the plots,  shows the best resemblance to the input data (see (a)) and
  the strongest collective component (see (b)).

