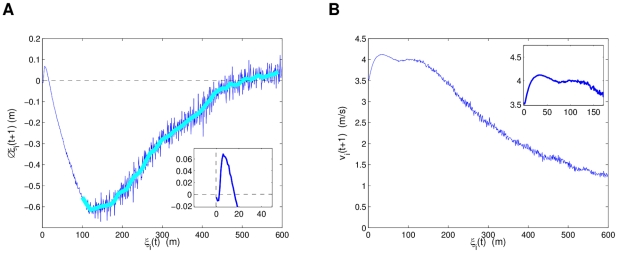
Figure 15. Change in separation symbolizing attraction(−)/repulsion(+), and speed distributions estimated from the simulations.
In (a) and (b) we have the changes in neighbor separation  and speed v respectively at the next time interval
  , as a function of
  at time t. The R2 model was built upon two-second sampling, and thus each time interval update
  is after two seconds. Plot (a) is consistent with short range repulsion and long range attraction as the main mechanisms of neighbor interactions.

